What are fair dice?
If you like games, you’ve probably played games with dice, and you’ve probably thought about fair and unfair dice.
You might have seen “trick dice” advertised in the back of a comic book, for instance, or you might have flipped a string of heads on a coin and thought your way into the Gambler’s Fallacy or an instinctive Bayesian sense that the coin is biased towards heads.
If you have studied statistics, you’ve encountered more mathematical ways to treat these human observational instincts, and in particular you would have a sense that you need a large number of trials to assess the fairness of a die, and that you can’t draw conclusions from an individual run of numbers or lack of numbers showing up on a die.
Still, the concept of fairness is surprisingly complicated to pin down, even given all the tools that statistics has to offer. There are several key points that I’d like to set down in relation to this project, to clarify terms and goals, and also to muse on the more enjoyable and thorny issues involved.
Ideal dice
Let’s start with a quick description of what we mean by an ideal game-playing die (yes, it’s one ‘die’, many ‘dice’).
When you roll a die, ideally you are randomly selecting one of the faces of the die. ‘Random’ here means you cannot predict which face will come up next. Each roll is also independent of the previous roll - that is, the odds of getting a particular face shouldn’t depend on what you’ve rolled in the past. And the probability distribution of the faces should be equal, or even - the probability of getting any face should be 1/6, or more generally 1/f, where f is the number of faces on the die (you may be used to dice being in the shape of cubes, but lots of other types are used).
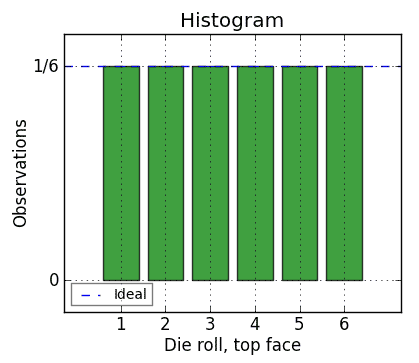
Those traits mean that, if you roll a fair die a lot of times, count how many times each face comes up, and graph it (this is called a histogram), your graph should look flat, like this:
The key phrase there is “a lot of times.” It hides a lot of complexity. If you roll a perfectly fair die for only a little while, say 20 rolls, you might get results like this:
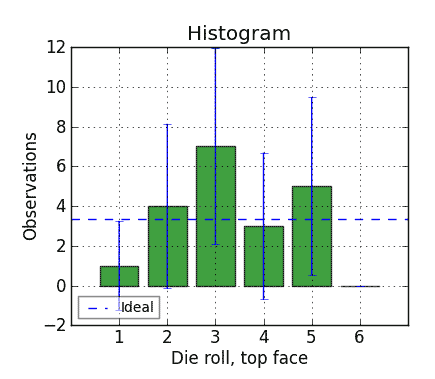
which doesn’t look flat at all. This is a familiar concept to anyone who has played games with dice and lost: randomness allows for lucky and unlucky streaks, even with a fair die.
So, if you want to find out whether a die is fair, you need to roll it enough times to get rid of that pesky variation and take comfort in the large numbers that will make everything come out ideally. Right? But how many times is that?
Turning the question around
It turns out that this is not the question you actually want to ask. Really, what you want to ask is this:
What’s a sufficiently big number of rolls to do a pretty good job of rejecting a die that is not fair, and how do I decide on that rejection?
That’s a more answerable question, and its parts turn out to be related.
The first piece of the answer relates to confidence intervals. You might have noticed the blue bars on the previous histogram. These are the “95% confidence intervals” for those bars; they mark the range that the bars will fall into for a fair die, 95% of the time. In other words, you would usually expect the confidence intervals to include the “ideal line” for a fair die
Note that the confidence intervals are really wide on that graph; one reason is that there are so few rolls (only 20). The more rolls you have, the tighter the confidence intervals. Here’s that graph for 6,000 rolls of the same die:
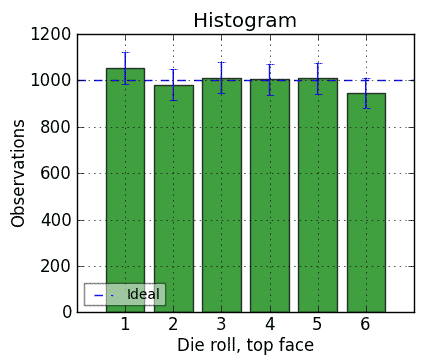
These confidence intervals are much tighter. And, they all include the “ideal” line, which is at 1,000 rolls (1/6 of 6,000).
If you increase the number of rolls beyond 6,000, the confidence intervals will continue to get smaller, and the histogram bars will generally tend to get closer to the ideal line for a fair die. But the confidence intervals don’t shrink all that fast… and even with a machine to roll the die, it takes time.
Even with a really enormous number of rolls, though, you still have to deal with the dark side of confidence intervals.
How to look at bars falling outside the confidence intervals
The great thing about a 95% confidence interval is that it gives you a benchmark: if a histogram bar is outside the confidence interval, it’s “bad.” Inside, it’s “good.” (Actually, on these graphs, you look at whether the confidence interval for a given bar includes the “ideal” line.) But then what?
A die is not unfair just because it has a bar outside the 95% confidence interval. Why not? Because the other side of saying “95% of the histogram bars for a fair die are within the confidence interval” is that “even for a fair die, 5% of the histogram bars will be outside the confidence interval.”
So if you decided on the rule: “Reject as unfair any die that has a histogram bar outside the 95% confidence interval after 6,000 rolls,” you would now have a clear procedure for testing dice - which is good - and it would produce a clear result - which is also good. But, you’d reject a fair die about one time in 20.
We can improve on this, though. Read on for the chi-squared test…