Mathematical tests for fair dice
My previous post on fair dice focused on some intuitive ideas about die fairness, and the beginnings of a mathematical approach. Now I’d like to describe the tests my die roller does. These are what I’ve settled on so far as a way to get some numbers to describe and compare the fairness of different dice.
The chi-squared test
First off, there’s the chi-squared goodness-of-fit test. This is a test that looks at the deviations in the histogram to get a total number (the chi-squared statistic) that characterizes how far the histogram deviates from ideal. You can also compare the result statistic to a mathematically-determined threshold that will give you a confidence value for the test; a 95% confidence is often chosen.
So hey, that’s great! We can reduce the whole set of results and its histogram to a single number for a given die, and then find out whether that die is fair or not with 95% confidence! Super! Right?
What it means to disprove a null hypothesis
The chi-squared test is useful in answering a very specific question, and this sometimes gets overlooked outside of statistics class. Officially, you use a chi-squared test (and most statistical tests) to “disprove the null hypothesis.” In our case, the “null hypothesis” is “the given distribution could be produced by a fair die,” and to disprove it means that that you have shown that either the die is unfair, or you have been unlucky.
Wait, what? Weren’t we supposed to get a clear decision out of this? Well, sure, we do - but only at the stated confidence value. What we get from a “fair” result is not “your die is fair and I’m 95% sure of that,” but “there is a greater than 5% chance that your die is fair given these trials.” That includes the case that the die is fair, but it also includes the case that the die is a unfair but you don’t have enough data to see it, as well as the case that your die is unfair but you just got (un)lucky.
And keep in mind also that a perfectly fair die will fail the test 5% of the time (for 95% confidence) - so if you test 20 perfectly fair dice, one of them (on average) will look unfair by this test.
So that’s a lot of backpedaling. An “unfair” result is wrong one time in 20, and a “fair” result doesn’t guarantee anything.
Statistical power
It gets a bit better, though, because we have a machine that can roll dice all night long. Instead of the minimum of n = 30 rolls often suggested for a six-sided die (min n = 5 x f, where f is the number of faces or sides), we can easily do 6,000 rolls overnight, for 1,000 x f. Shouldn’t that be about 200 times better somehow?
Yes; yes it is. The important factor here is statistical power, which determines not how accurate the test result is (it’s just statistics; it’ll be accurate if you did the math right) but how useful it is.
For instance, here’s a histogram of 30 rolls of a die:
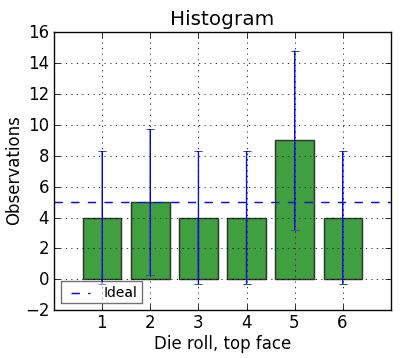
The chi-squared statistic for this run is 4.0. That translates to a 55% probability that the variation from expected is random - so it passes the chi-squared test. Looks pretty fair! Yay!
But look at those confidence intervals! They’re huge! They even include zero! So maybe we need more rolls to feel a bit more comfortable. Let’s include those first 30 rolls, but keep on rolling to n = 144 rolls:
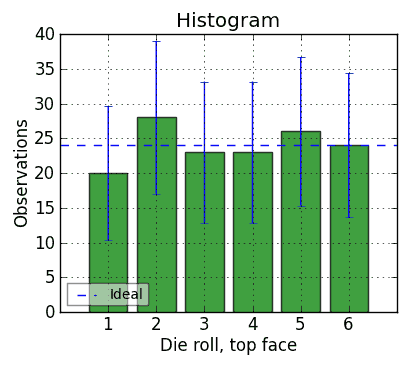
That’s more tedious to do by hand, and at n = 24 * f, maybe it’s a more reasonable test. The 1s are looking a little low, but they’re well within their confidence interval, and everything else looks plausible - if it were balanced so that 1 was down and 6 was up, you’d expect to see a lot more 6s, and that’s not happening. So it looks fair. And the chi-squared statistic is 1.58, for a 90% chance that the die is fair and the deviation from the expected value is random. Case closed?
Not if you have an automatic die roller. Let’s extend that same test on that same die to n = 6,000 rolls, including the ones shown above plus 5,856 more. We get this:
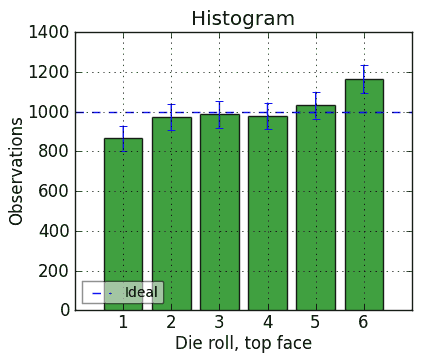
This now looks very unfair. Both the 1 bar and the 6 bar are well outside their 95% confidence intervals. And the chi-squared statistic is a whopping 47.2, which means there is a 0.0000005% chance that it is fair.
In fact, this was a die that had reasonably good test results when I first ran it. Then I modified it by drilling out all the pips on the 6 side deeply, moving its center of gravity toward the 1 side, so that it would roll 6 a lot more often. Then I ran the test pictured above. So, it is an intentionally unbalanced die, and the chi-squared test caught it… but after 6,000 rolls, not 30 or even 144.
There’s a very well-written discussion of power versus sample size in depth on this blog, complete with nice graphs, so I’m not going to duplicate his excellent analysis. For my purposes, the gist of it is that you need at least n = 100 x f rolls to get some decent power out of the chi-squared test, and 1,000 x f doesn’t hurt.
Fortunately, n = 1,000 x f is just what the Die Roller delivers, at what I call a reasonable time frame. At that number of rolls, the results are pretty powerful, even at a 1% level of confidence (so, only 1 in 100 false positives).
Cumulative histograms
Here’s another twist: the chi-squared test is looking at individual face histogram bars and their deviation from normal. But is that what you care about?
This will probably depend on what you’re interested in using dice for. If you play a game like “Dreidl,” for instance, or “Put And Take,” where each face of the die produces a completely different effect, chi-squared may be exactly the test you want. But a lot of people interested in fair dice are role-playing gamers, and a much more common idea in RPGs is to roll to beat a given value - that is, to roll either the target number or a higher number. These kinds of games use the dice not just to pick between one of several outcomes, but to generate a number - and the magnitude of the number is what matters.
If you’re doing that, you may be more interested in the cumulative histogram than in the plain vanilla histogram of die faces shown above (which I’ll call the ‘face histogram’ to distinguish it). A cumulative histogram for the die above can be drawn like this:1
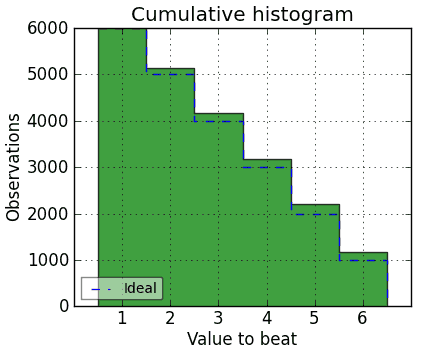
The dashed line shows, for every target number across the bottom, what the probability is that a random roll from a fair die will match or exceed that target number (OK, what’s shown is the actual totals; it needs to be scaled down by n to get the probability, but you get the idea). Any roll will always beat a one, you’ll beat a six only 1/6 of the time, you’ll beat a five 2/6 of the time, etc.
And the bars show how the given die differs from the ideal. The face histogram makes it clear that 6 is high and 1 is low, but the cumulative histogram makes it clearer just how much more likely you are to be able to beat, say, a 4 with that die.
Doesn’t that look more relevant to a lot of games than the face histogram? Too bad it doesn’t have a nice mathematical test associated with it.
The Kolmogorov-Smirnov goodness-of-fit test
Hey, neat, it does have a nice mathematical test! And the test has a fun name too: the Kolmogorov-Smirnov goodness-of-fit test. Please get the vodka jokes out of your system now. I’ll wait. Thanks.
The K-S test, like the chi-squared test, produces a statistic that you can compare to a precomputed threshold to decide whether a die is unfair. But it has a couple of advantages over chi-squared.
First, it’s based on the cumulative histogram, which may be more important to your application and consequently your idea of fairness.
Second, it’s somewhat more powerful than the chi-squared test, so it’s less likely to give false negatives and false positives for a smaller data set. (It’s not magic, though - it also did not discover the unbalanced die above at either 30 or 144 rolls.)
If your die doesn’t really have a numerical order to its faces (maybe they’re named “Red, Orange, Yellow, Green, Blue, Purple,” or “Stand Up, Bend Over, Sit Down, Shut Up, Shout, Freeze”), then K-S may not make sense - it requires numerical order to make that stair-step cumulative histogram. And, for smaller values of f, K-S may make less sense. So you can pay attention to the test that seems most useful - chi-squared has a notoriously hard time with 20-sided dice, for instance, and K-S doesn’t really have much meaning for flipping a coin (f = 2). As a rule of thumb, chi-squared is probably relevant for six-sided dice and below, and K-S is probably more relevant for dice with more sides than 6.
One wrinkle with using the K-S statistic is that most sources only show the K-S thresholds for continuous sampling - where you’re measuring something with a continuous range of values, instead of discrete, “binned” values like die faces. I have seen an algorithm for finding the discrete K-S threshold for a given value of f and number of rolls n, but it’s obscure2 and depends on the specific data. So, I have determined thresholds using Monte Carlo simulation, which basically means you simulate a lot of runs of a lot of random rolls (in my case, 100 million x f rolls total) and compute the K-S statistics for those runs, then find the 95th percentile of these statistics; that’s your 5% confidence decision variable.
“Flags” and graphs
Because there are at least these two statistical tests that are commonly known for testing die fairness, and there are at least two additional supporting pieces of information (face histograms and cumulative histograms) that are useful, the Die Roller’s analysis program doesn’t produce a single “fair”/”unfair” judgment. Instead, it displays some graphs, and reports “flags” for several things. Each flag is colored green, yellow, or red for “looks fair,” “not looking great” or “pretty definitely unfair,” respectively. The individual flags are:
- Histogram bars: Simply counts the number of histogram bars that are outside their 95% confidence intervals. One bar is a yellow flag; more is red.
- Chi-squared test: Yellow flag if the statistic is beyond the 95% confidence threshold, red if it’s beyond 99%, and green otherwise.
- Kolmogorov-Smirnov test: Yellow flag if beyond the 95% confidence, red if beyond 1%.
The graphs produced are the face histogram and cumulative histogram, as shown above, and also as these two:
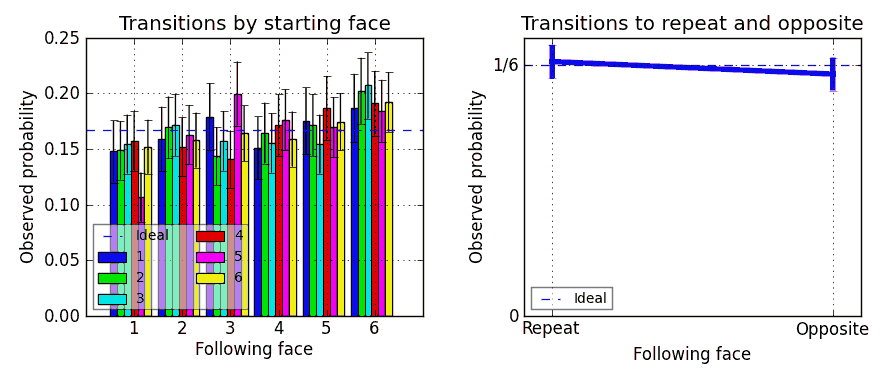
The one on the left is what I call a “digram histogram”: it’s the histogram of pairs of faces on consecutive rolls, such as 1 followed by 1, 2 followed by 1, 3 followed by 1, … 1 followed by 2, … up to 6 followed by 6 (for f = 6). These are useful for looking at patterns in the transitions between faces. Their 95% confidence intervals are larger, though, basically because there are more possibilities - and, because there are so many of them (f2 or 36), you would expect at least one or two digram bars to be out of its 95% confidence interval for every test of a perfectly fair six-sided die.
So, another flag is:
- Digram histogram bars: Shows yellow or red if the number of digram histogram bars that are outside their confidence interval are pretty high or high - figuring that you would expect to have 1/20 of them be high for a 95% confidence interval.
The graph on the right is useful to look at how fair the machine itself is, independently of the individual die being tested. It shows the sum of the digram bars that represent a transition from a face to the same face (the “repeat” transition), as well as the sum of digram bars representing a transition from a face to the face on the other side of the die - a complete flip-over (the “opposite” transition). An expected value line is also shown. If either or both of these is significantly far from the expected value, it might indicate that the machine is not rolling fairly. It should be mostly independent of the die’s own fairness.
I also report two flags that relate to this last graph:
- A flag colored according to how far the Self and Opposite bars are away from their expected values, and
- a flag colored according to how far away these bars are from each other. This last one is of dubious statistical merit, but I wanted to see it anyway.
That’s what the analysis produces. You get to choose whether you like 95% confidence, 99% confidence, one test or the other, and whether you want to look at any of the other supporting information.
Here’s a sample report, for that intentionally-unbalanced die referred to above - sorry it’s in plain text:
Analyzing: projects\d6-chessex-bsw-2mod
Faces: [1, 2, 3, 4, 5, 6]
6000 results.
Histogram: [ 866  974  985  979 1032 1164]
Confidence intervals: [62.89951766394573, 66.001097538113768, 66.300075182434526, 66.137365835775583, 67.544669218507181, 70.775031805977392]
High face: 6, low face: 1.
Faces outside confidence intervals: [True, False, False, False, False, True]

RED FLAG - 2 face histogram bars are outside their 95% confidence intervals.


RED FLAG - 5 digram histogram bars are outside their 95% confidence interval.

Chi-square statistic and p-value: 47.218, 5.12875263938e-09

RED FLAG - There's only a 0.00% chance this die is fair by the chi-squared test.


Normalized Kolmogorov-Smirnov test statistic: 2.53034911952
The decision variable for 95% confidence is 1.12; for 99% confidence, 1.39.

RED FLAG - There's less than a 1% chance this die is fair by the Kolmogorov-Smirnov test.


Machine flags:
Transitions to repeat and opposite, normalized: [0.16916666666666666, 0.16083333333333333]
GREEN FLAG - the apparatus seems to be flipping dice and repeating about the right amount, within the 95% confidence interval.
GREEN FLAG - It's not repeating more often than it's flipping over, within 95% confidence.
-
You might think this is drawn backwards. You’d be right. It accumulates from right to left instead of from left to right, so it can show the “probability to meet or exceed” instead of the “probability to roll at or under.” It’s just because the former is more often used in games. ↩
-
Conover, W.J. [1972]. A Kolmogorov goodness-of-fit test for discontinuous distributions. Journal of the American Statistical Association 67, 591-596. Not available for free download as far as I know, but I have a copy if you’re interested. ↩
- Login to post comments